Key Takeaways
- The Season Starts Early: 75% of back-to-school (BTS) consumers begin shopping before August. The absolute peak is July, accounting for 40% of all buying activity, while June serves as a critical research phase (12%).
- Billion-Dollar Market Projections: Average household spending is projected at $1,013 for K-12 families (creating an estimated $34 billion national market) and $1,114 for college households.
- Top Spending Categories: For K-12 households, clothing and apparel represents the single largest expense at $208 per household, followed closely by accessories ($168) and electronics ($158). For college households, electronics lead the pack at $263.
- Budgets Are Stretching: Spending is rising across the board, with 62% of shoppers stating they plan to spend more money this year than last.
- The Conversion Playbook: While online channels win on convenience (42%) and easy price comparison, physical storefronts still hold the advantage for instant gratification and tactile inspection. Online retailers can close this gap by prioritizing upfront user reviews on fit/quality, sizing calculators, and risk-free return policies.
The traditional retail landscape, defined by a frantic late-summer trip to a local department store, has fundamentally evolved, and so have back-to-school shopping trends.
According to a recent Bizrate Insights survey of over 500 U.S. adults, back-to-school (BTS) consumers are behaving with greater strategy, utilizing a digitally blended approach, and operating with a high level of deliberate intent.
Parents are no longer reacting exclusively to school supply lists in mid-August. Instead, they are elongating the shopping season, expanding their product discovery across multiple digital nodes, and aggressively cross-referencing multi-channel pricing.
To capture a meaningful share of the $34B K-12 market and the $1,114 average college household spend, online retailers need more than a seasonal promo calendar. They need a clear plan for merchandising, pricing, fulfillment, customer feedback, and digital experience.
Winning these modern shoppers requires understanding the primary digital drivers, which include convenience, price transparency, and catalog depth. Simultaneously, e-merchants must actively engineer solutions to combat the tactile advantages and immediate gratification offered by brick-and-mortar storefronts.
For additional context on how back-to-school strategies have evolved, visit Bizrate Insights’ earlier look at 2024 back-to-school retail strategies.
Back-to-school shopping season starts before August
By the time peak August marketing campaigns launch, 75% of all BTS consumers have already started shopping.
- May to June (12%): Research phase. Shoppers focus on brand discovery, list building, and inventory checking.
- July Peak (40%): The heavy buying phase. Shoppers look for core promotions, bundling opportunities, and high-intent conversion.
- August last mile (25%): The final rush. Shoppers prioritize immediate availability and fast shipping guarantees.

For online retailers, the window to capture shoppers opens in June and peaks in July. A strong back-to-school strategy should lead with planning content, shopping guides, and list-building tools in June and early July, shift to promotions and basket building through mid-July, and close with urgency, fast delivery, and last-minute essentials in August.
Retailers can also use a retail Voice of Customer insights calendar to plan around key seasonal moments, monitor shopper feedback during the rush, and capture learnings for the next year.
Retailers that wait until late summer risk missing the majority of the season.
Back-to-school shopping trends: shoppers are using both online and in-store channels
The biggest takeaway is that back-to-school shoppers are not choosing only one channel. Most are blending online and in-store shopping throughout the season.
Nearly two-thirds of shoppers, 63%, expect to use a mix of online and in-store channels. Only 25% plan to shop mostly in-store, while 12% expect to shop mostly online.

That means online retailers should think beyond a single transaction.
Back-to-school shopping often starts with research, list-building, price comparison, and product discovery before shoppers decide where to buy. Retailers that support the full journey can stay top of mind from planning through checkout.
This blended behavior matches broader online shopping habits, where shoppers move across websites, devices, marketplaces, and stores before making a final decision.
Retailers that support the full journey can stay top of mind from planning through checkout. For retailers with physical locations, buy online, pick up in store can help bridge the gap between digital convenience and in-store immediacy.
To win market share from physical storefronts, online merchants must understand the specific friction points that drive channel selection.
- The digital advantage: Shoppers choose online channels for efficiency. The main drivers are 24/7 shopping convenience, bypassing long store lines, rapid multi-tab price comparison, and broader product availability.
- The physical advantage: Physical retail wins on immediate gratification and risk mitigation. Consumers prefer brick-and-mortar stores for categories requiring physical inspection, such as apparel sizing, material quality verification, and immediate possession.
The online playbook to close the friction gap
To counter the physical advantages of traditional retail, online merchants should move beyond simple discounting and focus on experience-driven trust.
- Optimize high-value categories: Apparel ($208 average spend) and Electronics ($158 average spend) carry the highest financial risk for parents. Product pages must prominently feature verified user reviews regarding fit and quality to neutralize the physical store advantage.
- Remove sizing anxiety: Implement interactive sizing calculators and clear comparison charts to reduce cart abandonment and lower product return rates.
- Promote risk-free policies: Explicitly highlight low-friction, free return parameters directly on product pages to give parents the confidence to buy online.
- Combat hidden checkout costs: Higher-income tiers are willing to spend what it takes but are sensitive to unexpected fees. Set clear free-shipping thresholds to increase average order values safely.
- Build trust with authentic customer feedback. Shoppers want to know that reviews are real and relevant. Using verified customer reviews can help reduce uncertainty, especially for products where quality, sizing, or value are hard to judge online.
Online retailers are already a major back-to-school destination
Online-only retailers are already playing a major role in back-to-school shopping. 59% of shoppers plan to buy from online-only retailers, making them the second most common shopping destination behind mass retailers at 72%.

This puts online-only retailers ahead of apparel retailers, office supply stores, and electronics retailers.
The message is clear: online is not a secondary channel for back-to-school. It is one of the main ways families plan to shop.
To gain share, online retailers need to compete not just on assortment, but on ease. Clear categories, grade-level shopping guides, fast shipping, and simple returns can help shoppers feel confident buying online.
Convenience, price comparison, and shipping drive online shopping
Shoppers are going online because it solves practical problems. The top reason for shopping online is convenience, cited by 42% of shoppers. Other major drivers include avoiding crowds and checkout lines, easier price comparison, greater selection, and free or discounted shipping.

These benefits should be front and center in back-to-school marketing. Retailers can improve conversion by highlighting savings, delivery timing, free shipping, and easy ways to compare products.
Online retailers should also make it simple to build a complete basket. Supply kits, product bundles, “frequently bought together” recommendations, and list-based shopping tools can reduce friction and increase average order value.
In-store shopping still wins on fit, speed, and confidence
Even though online shopping is strong, in-store retail still has advantages.
Shoppers who prefer stores are often looking for confidence and immediacy. They want to confirm the right size or fit, get items immediately, see and touch products, and find in-store deals.
This is especially important for apparel, shoes, backpacks, and electronics. Online retailers can close the confidence gap with more detailed product pages. Detailed photos, size guides, customer reviews, fit notes, comparison tools, and easy exchanges can reduce hesitation.
Fast delivery also matters. When shoppers need items quickly, clear delivery dates and last-minute shipping options can help online retailers compete with the immediacy of stores.
Back-to-school spending is rising, but budgets still matter
Many shoppers expect to spend more this year. 64% say they will spend more than last year, including 21% who expect to spend significantly more.

At the same time, 28% expect to go over budget, and 55% say they will spend what it takes.

This creates a strong opportunity for retailers that help shoppers manage costs. Budget filters, bundle discounts, loyalty offers, price-drop alerts, and cart-level savings messages can make shoppers feel more in control.
Value messaging should be clear and specific. Instead of only promoting broad sales, retailers should show shoppers how to complete their list while staying within budget.
K-12 households plan to spend $34 billion this season
- K–12 families expect to spend an average of $1,013 per household on back-to-school items this season, projecting to an estimated $34 billion in total K–12 back-to-school spending nationally.
- College households expect to spend an average of $1,114 per household.

Clothing and apparel is the single largest category for K–12 households at $208, followed by electronics ($158) and shoes ($131).
College parents outspend across nearly every category, with particularly elevated spend on electronics ($263) and personal care ($168).

Methodology
Survey and sample. Data were collected in May 2026 via an online survey from 538 U.S. adults. Respondents were screened to include only those who expected to shop for back-to-school items and who identified as a parent or guardian of a K–12 or college student, or as a college student shopping for themselves.
Average spend calculation. Category and total spend were collected using predefined ranges. The midpoint of each range was used as its representative value (e.g., $174 for $100–$249; $749 for $500–$999).
For the open-ended top band (“$1,500 or more”), a value of $1,750 was assumed, reflecting conservative central tendency among a panel that skews toward moderate income levels. The weighted average was computed by multiplying each midpoint by the proportion of respondents selecting that band and summing across all bands.
Total market projection. The K–12 total spend estimate of $34 billion was derived by multiplying the K–12 household average ($1,013) by approximately 33.6 million U.S. family households with children under 18, as reported by the U.S. Census Bureau Current Population Survey (2025).
This projection is intended as a directional market-size estimate; actual spend will vary based on household composition, geography, and economic conditions.
Limitations. With n=538, the margin of error is approximately ±4.2 percentage points at 95% confidence for topline figures. Subgroup estimates are based on smaller samples and should be interpreted directionally. Spend figures reflect stated intent, not observed behavior, and may differ from actual purchases.
Introduction: Ecommerce Conversion Optimization in 2026: Why Free Shipping, Returns, and Pricing Transparency Matter
Rising prices are reshaping how consumers shop online, but ecommerce conversion optimization in 2026 is not solely about offering the lowers price. The retailers best positioned to win may not be the ones with the lowest prices, but the ones with the fewest friction points.
A new Bizrate Insights survey of more than 1,000 U.S. consumers reveals that expectations around free shipping, transparent pricing, and return policies have become make-or-break moments in the moment a shopper decides to buy. Miss them, and shoppers don’t just abandon their cart. More than half deflect straight to a competitor.
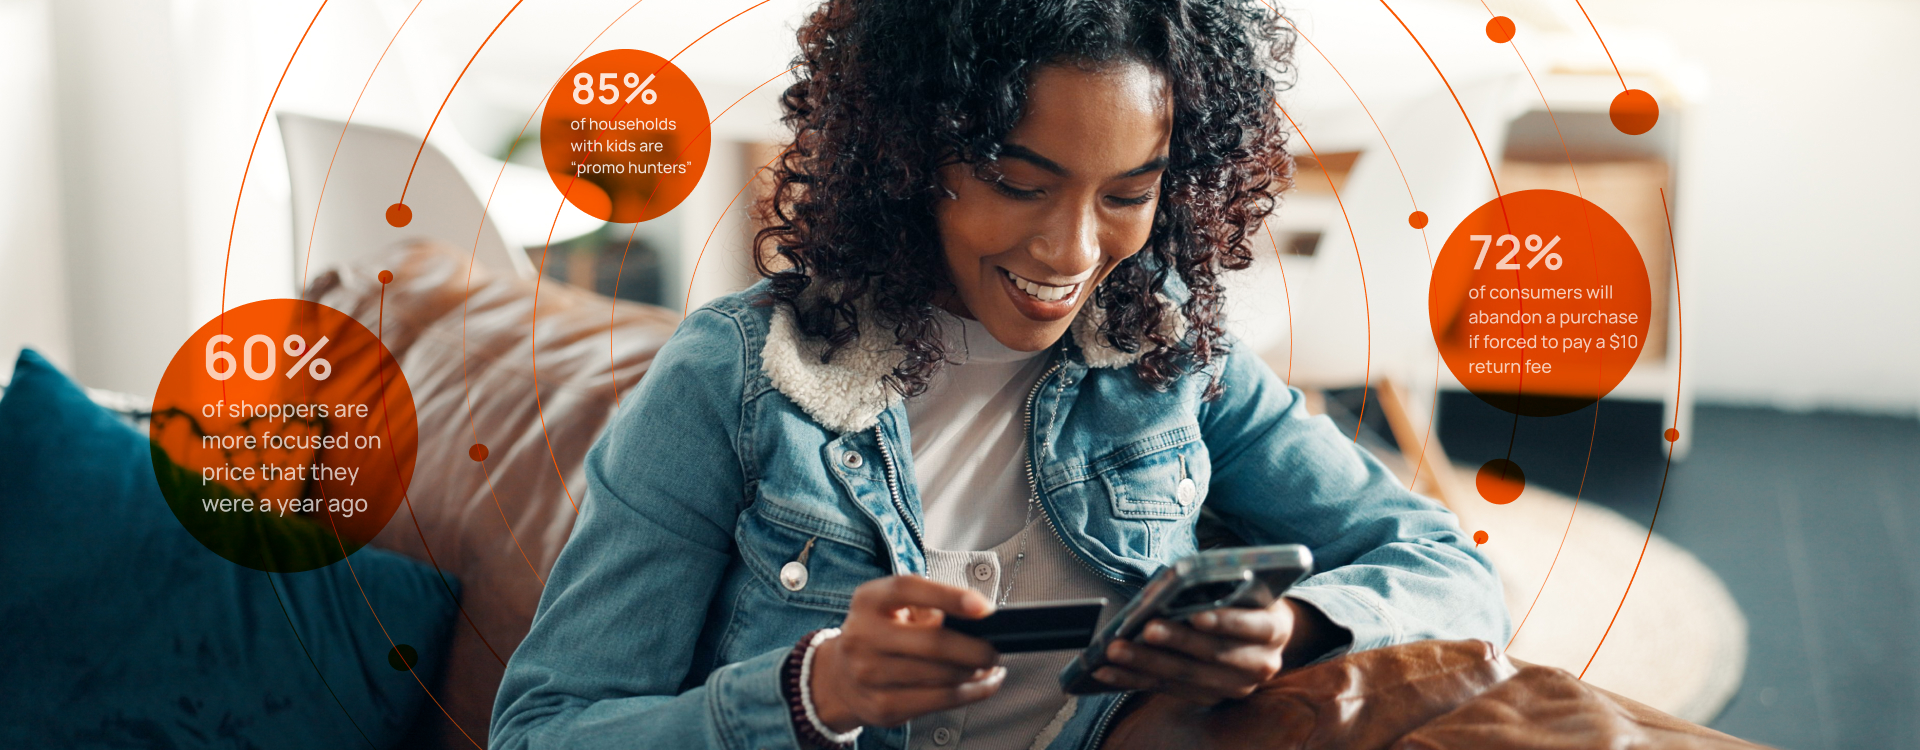
Underlying all of this is a pervasive economic anxiety. Nearly 69% of shoppers say they are very or extremely worried about inflation and rising prices, and that concern is showing up directly in purchasing behavior. Six in ten shoppers say they are more focused on price today than they were a year ago.
Yet the data also reveals something unexpected. Consumers aren’t pulling back. Nearly two-thirds (63%) shop online at least weekly, and 35% have actually increased their frequency over just the last three months. This is a market that is active, engaged, and highly attuned to value.
The retailers who understand that distinction will be positioned to win.
Inflation anxiety is changing online shopping behavior
Beneath all of this behavior is a pervasive economic anxiety. Sixty-nine percent (69%) of shoppers are very or extremely worried about inflation and rising prices and that concern isn’t distributed evenly. Women (73%) are more worried than men (65%), and lower-income households under $50K (73%) and households with kids (78%) are especially stressed.
This anxiety is showing up directly in purchasing behavior. Six in ten shoppers say they are more focused on price today than they were a year ago.
Free shipping is now a top ecommerce conversion lever
When asked what matters most in choosing where to shop, free shipping (57%) beat out lowest price (45%) by a significant margin. Brand trust came in third at 27%, followed by discounts and promotions at 26%.
Free shipping isn’t just a perk anymore. It’s the baseline expectation that determines where shoppers will even consider buying. The effect is especially pronounced among older shoppers, with 79% of those aged 65+ prioritizing free shipping, as do 58% of low-income earners.
Even among high-income earners ($200K+), 45% still put free shipping first. The message is consistent across every segment: the perception of getting a deal on shipping consistently outweighs a lower item price.
Where shoppers expect free shipping thresholds to start
Shoppers have a clear mental model for what earns free shipping: 56% expect it once they’ve spent between $25 and $49. Another 8% expect shipping to always be free regardless of order size.
Retailers who set their free shipping threshold above $50 are likely triggering abandonment and those who set it well above that are almost certainly losing customers who feel their expectation isn’t being met.
Aligning thresholds to the $25–$49 range isn’t just generous; it’s a direct conversion optimization.
Unexpected fees are driving checkout abandonment
If free shipping is the biggest attractor, surprise fees are the biggest repellent. Forty-two percent of shoppers say they frequently or very often abandon a cart due to unexpected costs; things like taxes, handling fees, or charges that only appear at the final step of checkout.
Younger shoppers are the most reactive: 60% of those aged 18–34 abandon often when surprised by extra costs. Parents (55%) are more likely to abandon than non-parents (38%).
Only 12% of shoppers say they rarely or never abandon due to extra costs, meaning almost everyone is at risk of losing a sale this way.
Unexpected fees are driving checkout abandonment
Of all the friction points in the checkout experience, paid returns may be the most underestimated. A $10 return fee on a $50 purchase is enough to drive 72% of shoppers to abandon the transaction.
Women (73%) and shoppers aged 35–44 (77%) are the most sensitive.
But what happens next is equally revealing: of those who abandon, 52% defect directly to a competitor offering free returns, and another 28% go searching for a cheaper alternative elsewhere. Only 7% abandon the purchase entirely.
The takeaway is sharp: paid return policies don’t just lose sales. They actively hand customers to competitors.
Smaller discounts can still convert hesitant shoppers
One of the most actionable findings in this study is just how modest a discount needs to be to convert a hesitant shopper. Forty-three percent of shoppers say a 10 to 20% discount is the minimum needed to tip them from “on the fence” to “purchase complete.”
Only 17% require a discount of 30% or more. Men are even easier to convert with smaller offers: 54% respond to 10–20% off, compared to 44% of women. Older shoppers are the most easily converted segment, with 63% moved by discounts in that modest range.
The implication for promotional strategy is significant: many retailers are likely over-investing in deep discounts, burning margin to convert shoppers who would have responded to a much lighter offer.
Promo hunting is now a near-universal behavior
Discounts don’t just work when offered, shoppers are actively seeking them out. Seventy-eight percent of shoppers describe themselves as active promo code hunters, seeking out codes all or most of the time before completing a purchase.
Thirty-one percent say they always look for a code and won’t check out without one. Only 2% say they rarely or never look.
This behavior is even more pronounced among women and households with kids (85%).
The implication is clear: if a customer can’t find a promo code on your site, they will leave to look for one on coupon aggregators, competitor sites, or Google, and they may not come back.
Proactively surfacing or auto-applying promo codes isn’t just a nice conversion nudge; it’s a retention mechanism that keeps shoppers in your funnel rather than sending them off-site.
Parents are a high-value ecommerce audience
Not all shoppers are created equal, and one segment stands out above the rest: households with children.
Parents are high-frequency, high-engagement, and highly promo-responsive; a powerful combination for any retailer.
Consider the following:
• 76% of households with kids shop online at least weekly, compared to 57% of non-parents.
• 51% have increased their shopping frequency in the last three months, versus just 30% of households without kids.
• 85% are active promo code hunters, making them the segment most likely to convert when the right offer is in front of them.
They also buy across a wider range of categories, over-indexing on clothing, groceries, beauty, health, toys, pet supplies, books, home improvement, and home goods. The only category where they don’t over-index is electronics.
For retailers with broad assortments, parents are the audience most worth investing in — both through targeted promotions and through the experience features (free shipping, transparent returns) that drive their loyalty.
The bottom line
The clearest takeaway from this research is that conversion in 2026 isn’t won on price alone — it’s won on clarity, value, and ease.
Recommendations
Eliminate surprise costs
42% abandon due to unexpected fees, 72% will walk over a $10 return fee → Show total cost (shipping, taxes, returns) early
Right-size your discounts
10–20% converts 43% of shoppers → Avoid margin-killing promos, target instead
Win with free shipping, not lowest price
57% prioritize free shipping over price → Set thresholds at $25–$49 to match expectations
Keep promo seekers in your funnel
78% look for codes before checkout → Auto-apply or surface codes to prevent drop-off
Shoppers aren’t asking retailers to be the cheapest option in the market. They’re asking for transparency about total cost, for free shipping at reasonable thresholds, for return policies that don’t feel punitive, and for discounts that feel attainable.
Meet those expectations and you earn the sale, and very likely the repeat visit. Miss them, and 72% will walk, half of them straight to a competitor. The brands that will win this environment are those that treat pricing friction as a conversion problem, not just a cost management decision.
Methodology
This study was conducted by Bizrate Insights via an online survey among a sample of 1,010 U.S. adults. Fieldwork was conducted from March 20 to March 29, 2026.
Respondents were recruited through Bizrate’s panel, along with partner panels, and were screened to meet key eligibility criteria, including age and shopping frequency.
The sample was designed to be representative of U.S. adults age 18+.
The margin of error for a sample of this size is approximately ±3.1 percentage points at the 95% confidence level.
Percentages may not sum to 100% due to rounding. Differences between subgroups are tested for statistical significance at the 95% confidence level.