Bizrate Insights· Author
As October rolls around, retailers and consumers alike turn their attention to Halloween, a holiday marked by fun, costumes, and candy. This festive time of year offers valuable insights into consumer behavior – our main focus at Bizrate Insights. We recently conducted a survey of verified customers from our partner network. In this blog post, we’ll shed some light on how consumers are planning for Halloween this year.
How do they celebrate Halloween?
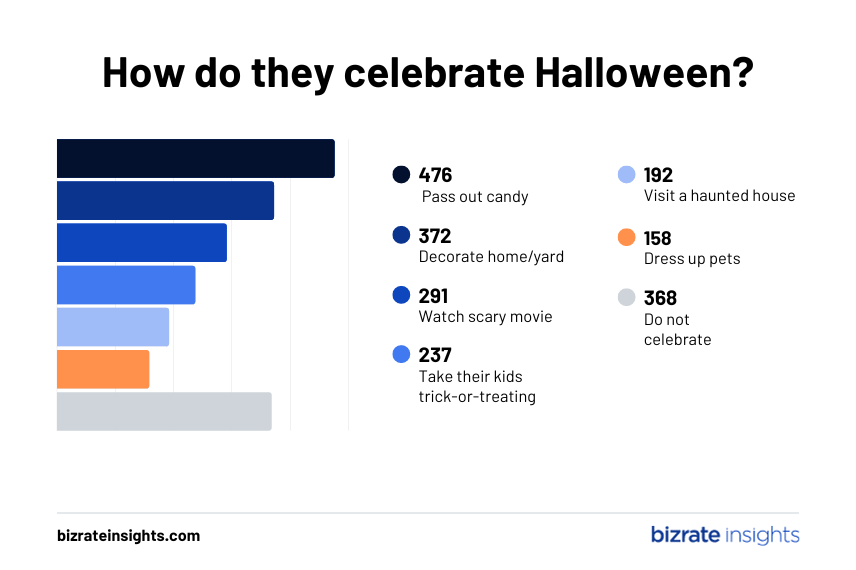
The data indicates a substantial number are looking forward to passing out candy (476) and decorating their homes or yards (372). Noticeably, a significant portion (368) chose not to celebrate the holiday. Decorating their home or yard is an important tradition for many respondents. Many participants indicated they’ll be watching scary movies and going trick-or-treating. As shown in a later chart, spending on costumes is part of this tradition. Pet owners enjoy dressing their furry minions as well.
Download our Halloween Insights infographic
When do they start shopping for Halloween?
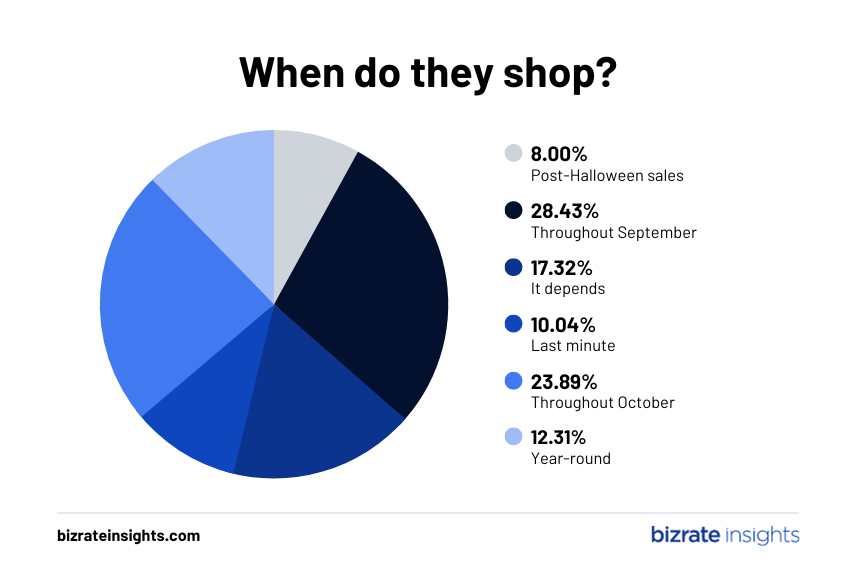
Most shoppers begin their search for Halloween items in September (28.43%) and October (23.89%). A small but notable 8% look for sales post-Halloween. Ecommerce store owners can benefit by aligning their promotional activities to these shopping patterns, ensuring they capture the attention of both early and last-minute shoppers.
Where do they shop for Halloween?
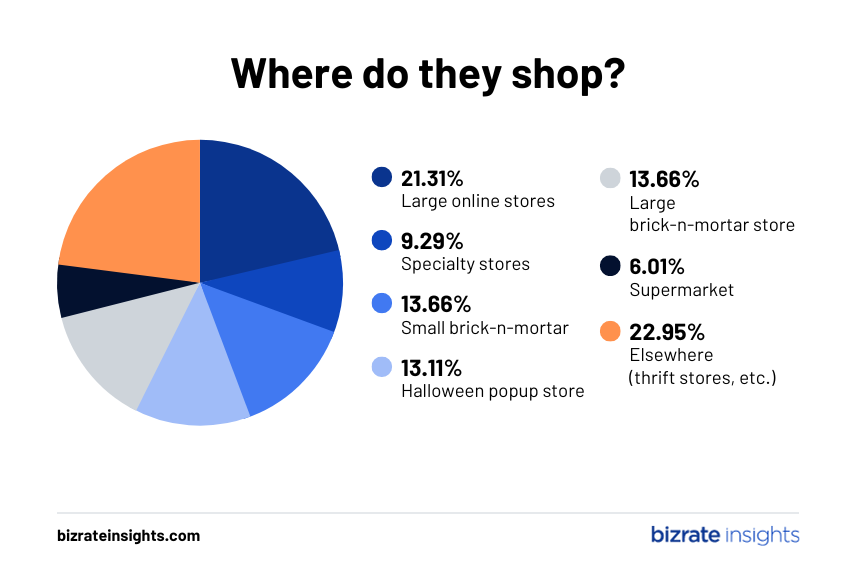
While slightly more than 1 in 5 respondents look to large online stores, the same percentage enjoy shopping at thrift stores and specialty stores. The savvy ecommerce merchant could attract this demographic with targeted marketing.
Understanding Consumer Spending
According to the National Retail Federation, Halloween spending will reach $12,2 Billion this year. This is a climb of 1.35X over consumer spending five years ago. Our survey analyzes where that spending goes:
Spending on Costumes
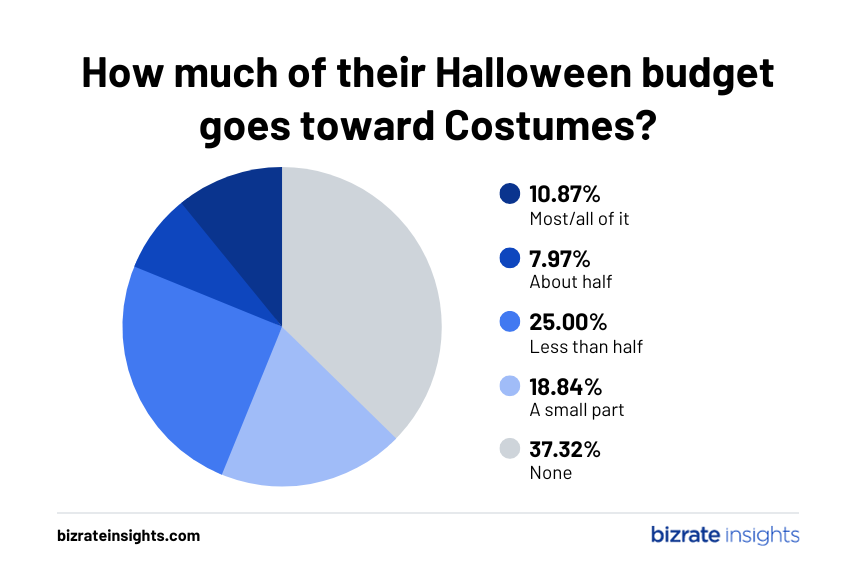
A large percentage of consumers (62.68%) spend on costumes. Almost 1 in 5 go all out, spending more than half of their budget – or all of it – on costumes. A quarter of respondents spend less than half of their Halloween budget on costumes, and slightly over 1 in 3 respondents don’t spend on costumes at all.
Spending on Decorations
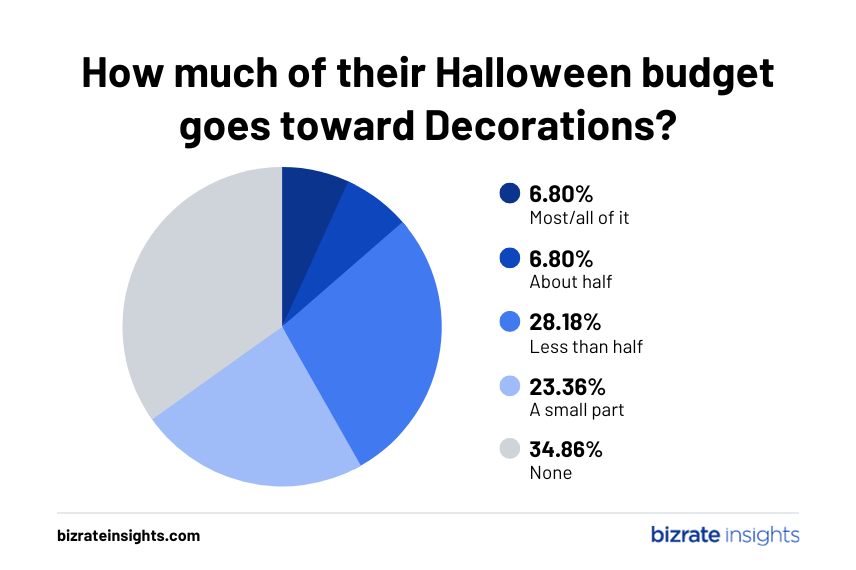
About two-thirds of all respondents (65.14%) invest in decorations for their home or yard. Consumers largely indicated they spend less than half of their budget on decorations, with only 13.6% of respondents going all out and spending most or all of their budget on making their house the scariest on the block.
Will you spend more or less than last year?
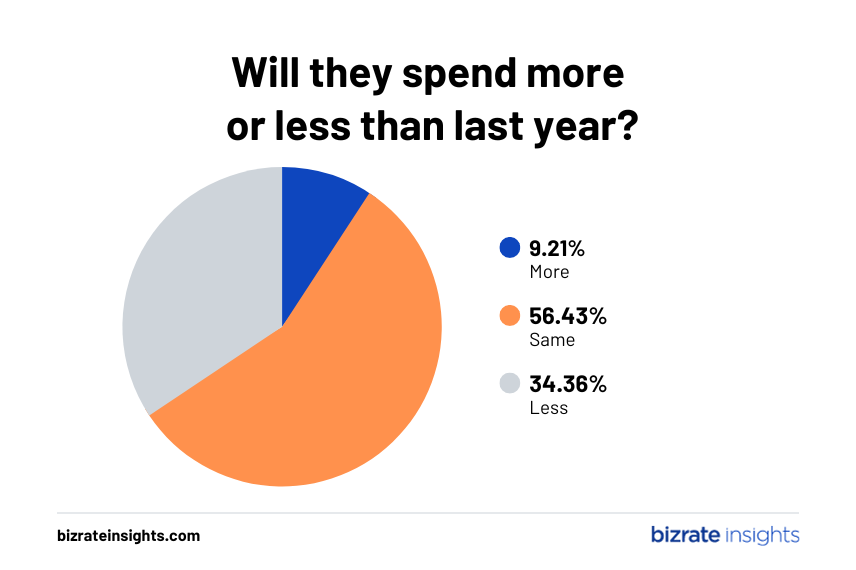
The great news for retailers everywhere, including ecommerce merchants, is that the majority of consumers (56.43%) plan to spend the same amount as the previous year, suggesting a prosperous shopping season.
Download our Halloween infographic for additional insights!
Our infographic displays additional consumer spending insights and data analysis.
You can download it here, or by clicking the image below:
Get In Touch With Us
Our multi-channel capabilities and breadth of experience working with organizations in every vertical make us the industry leader in Voice of Customer Solutions.
Schedule A Call